Every number, back to the filing.

Ask any question about a listed company’s financials. LogosQuant answers from the company’s own filing, and every figure traces back to the fact it tagged.
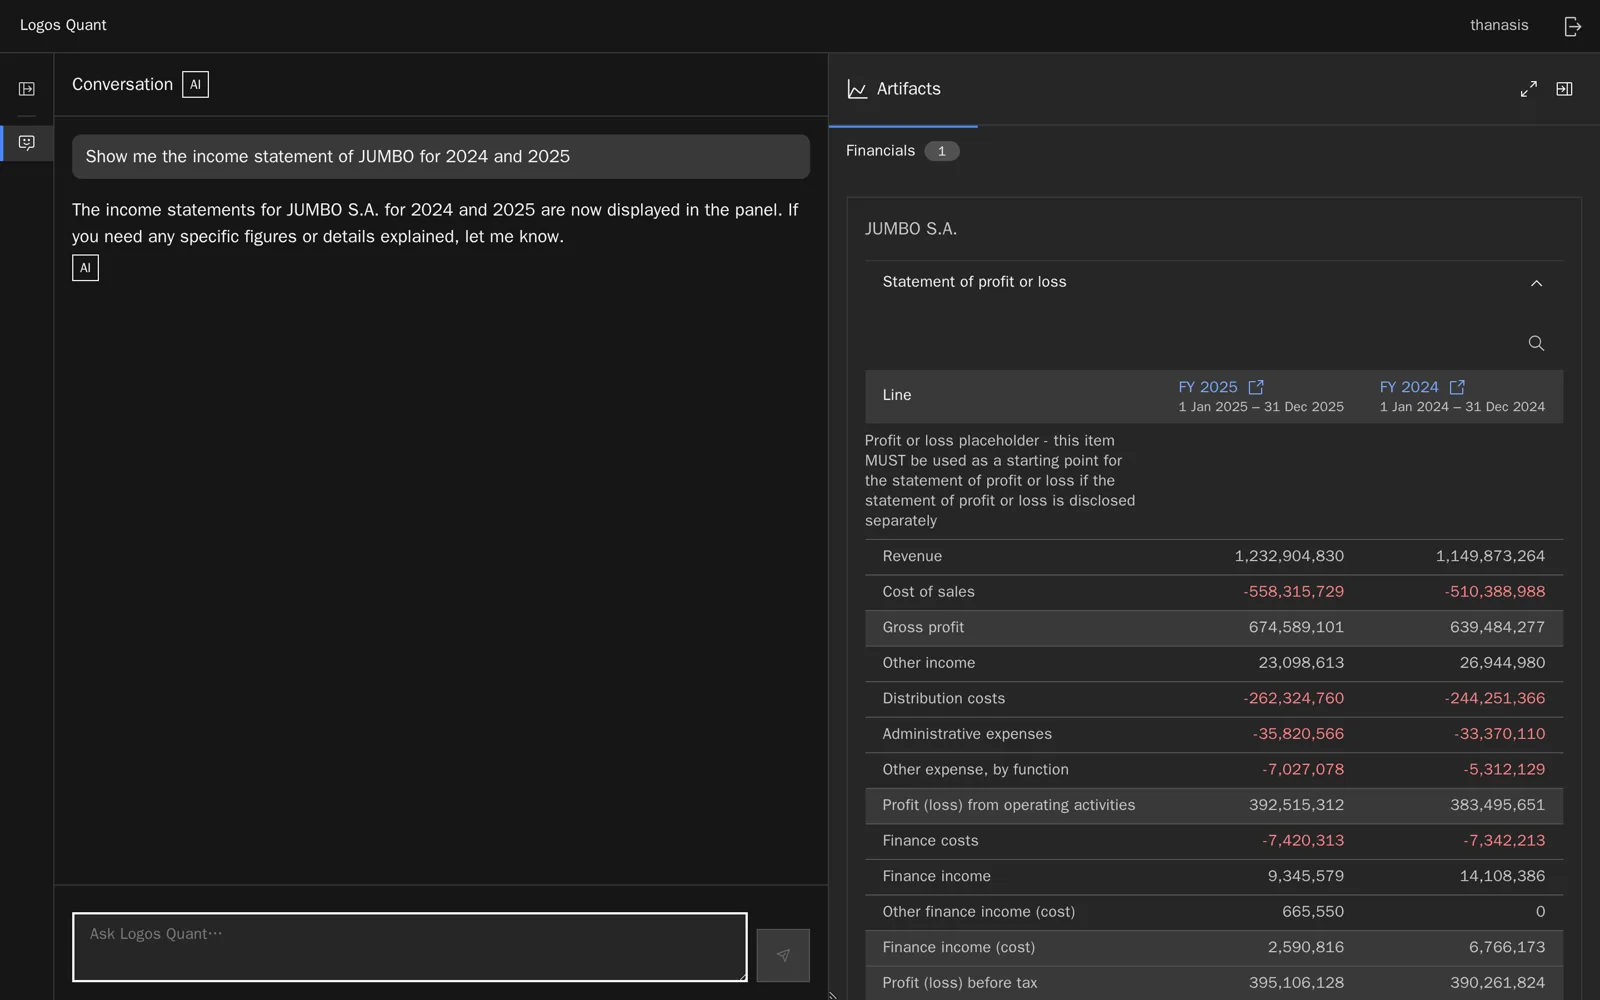
A question about JUMBO’s income statement in the chat, and the statement as filed in the panel beside it
1,002companies
25countries
4,985annual filings
7.8Mtagged facts, each traceable

The problem

The data is public. The answer is not.

Every filing is tagged

EU listed companies file their annual reports in machine-readable ESEF/XBRL, and US companies file in XBRL.

Few can read it

Terminals are priced for institutions. Screeners flatten accounting choices and skip small and mid caps.

Chatbots guess

A general AI assistant answers fluently, but nothing ties its number to what the company filed.

What it does
One conversation, with the evidence beside it

Statements, as reported

  • Exactly as the company filed them: its lines, its labels, its order.
  • Each year opens the filing itself, in its source’s own viewer.
JUMBO’s statement of profit or loss as filed, FY2025 and FY2024

Breakdowns, as the filer tagged them

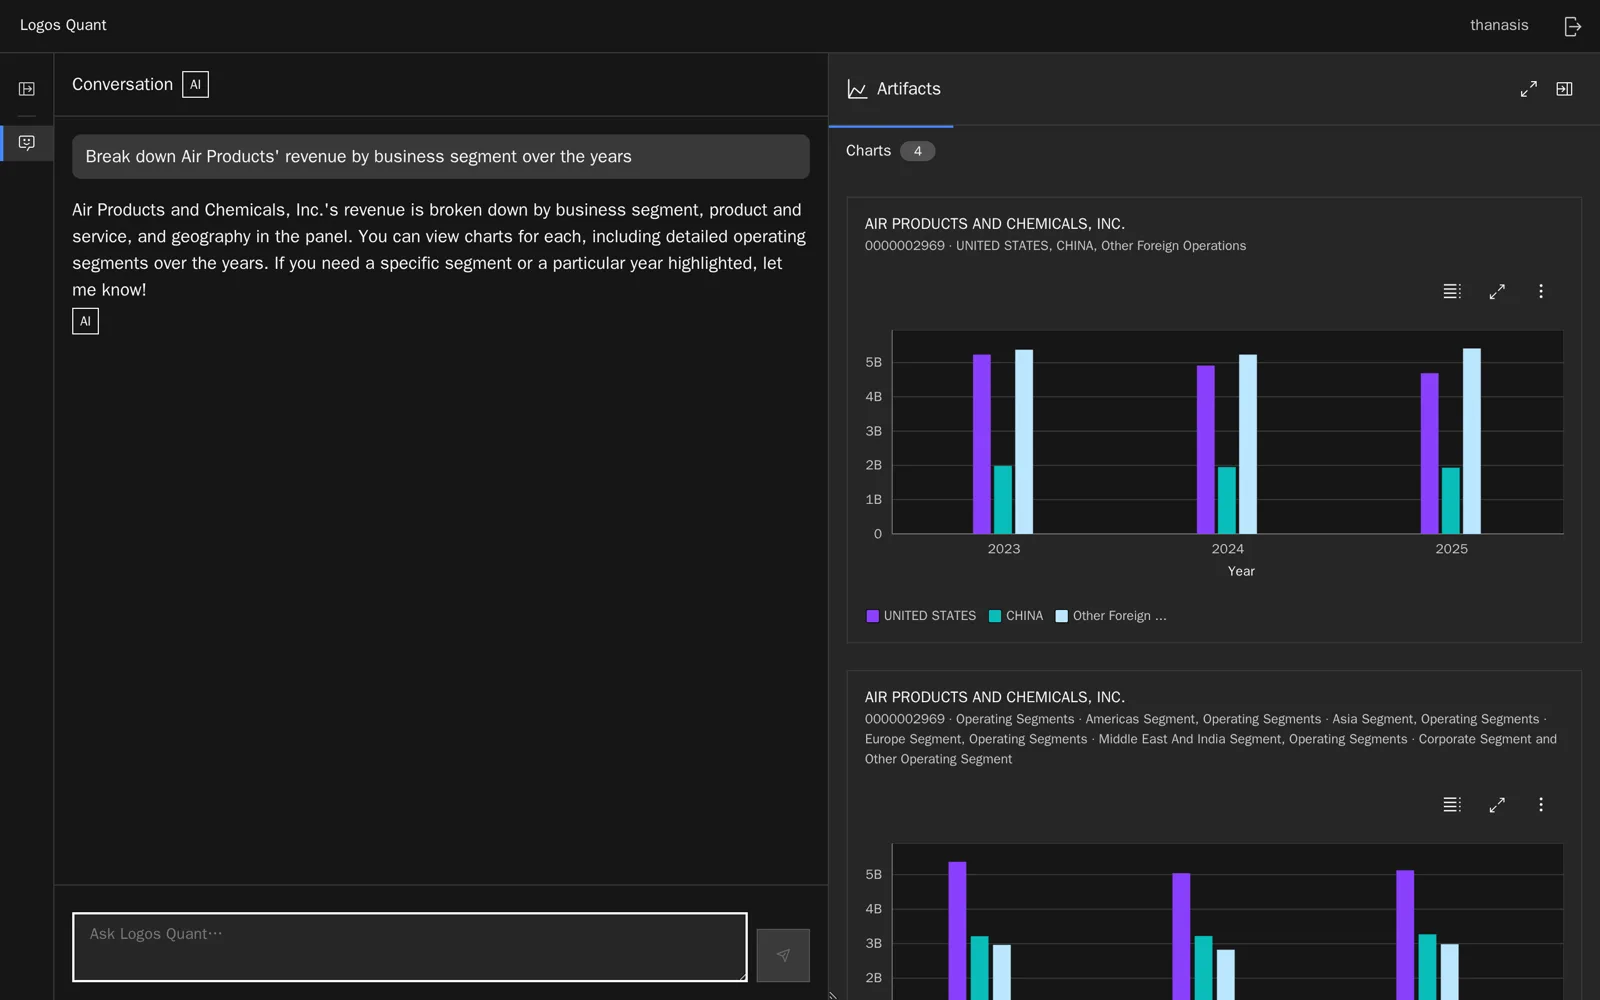
  • Revenue by country, by segment, by product: every axis the filer tagged.
  • Charted straight from the filer’s own tables, year by year.
Air Products’ revenue by country and by operating segment, 2023 to 2025

Notes and disclosures

  • The story behind the numbers, searched by meaning.
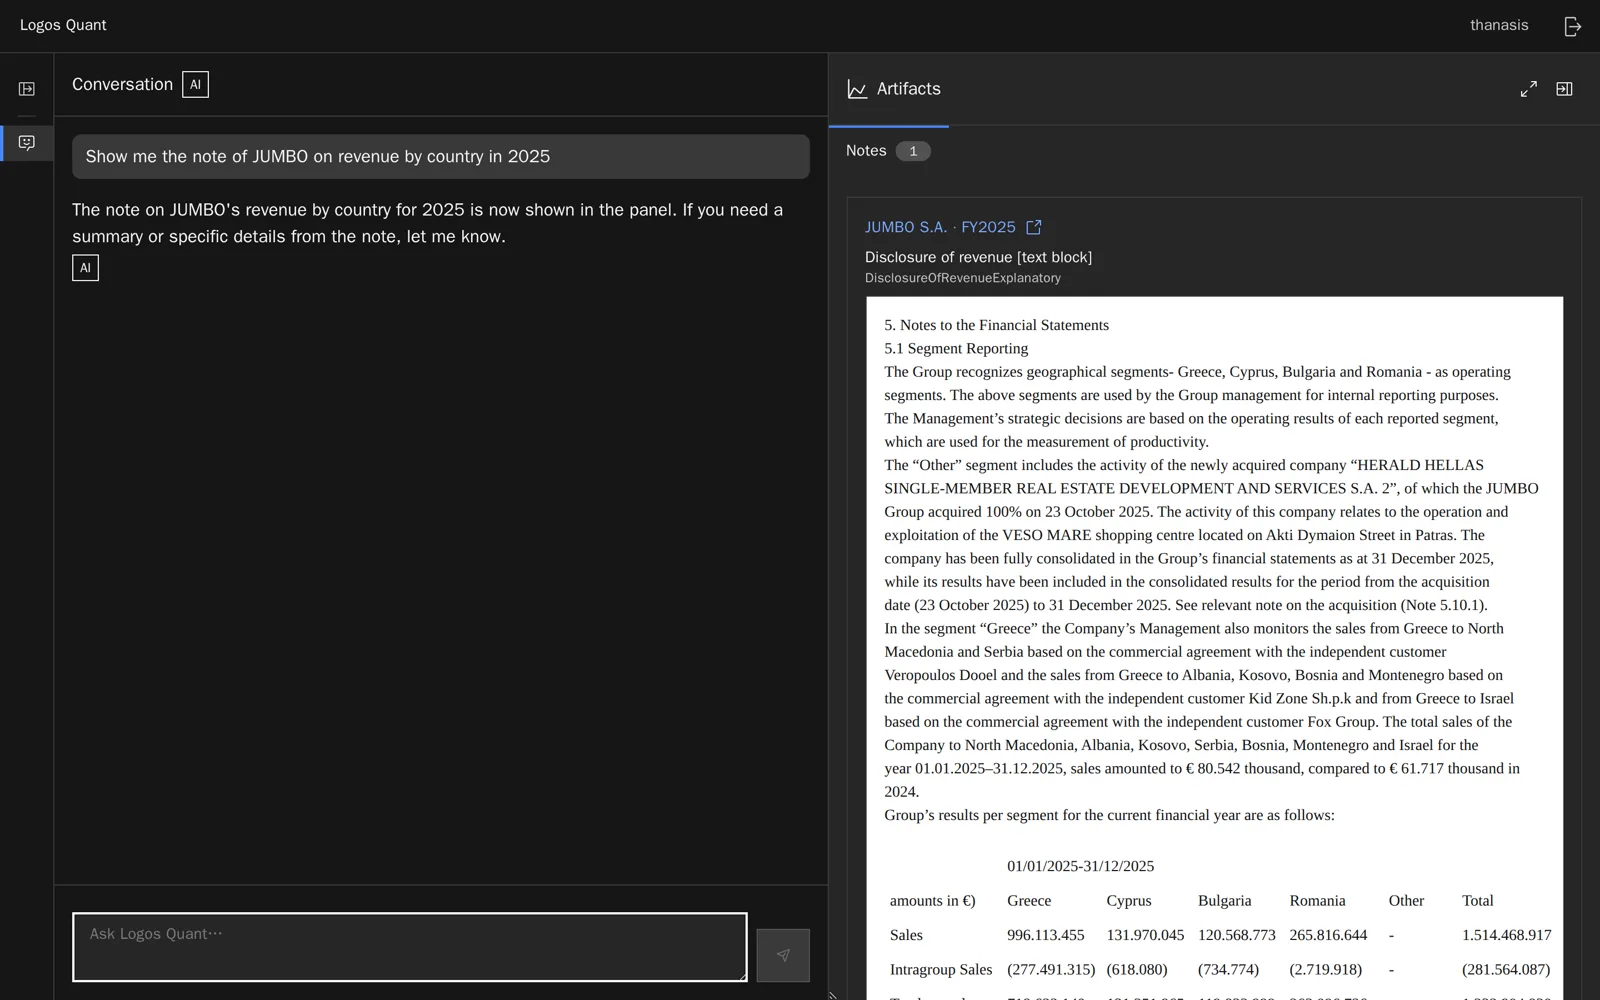
  • The note opens as the company wrote it, across years and companies.
JUMBO’s 2025 segment note, with its table of sales by country

Ratios and charts

  • Margins, returns, leverage, liquidity, growth, free cash flow.
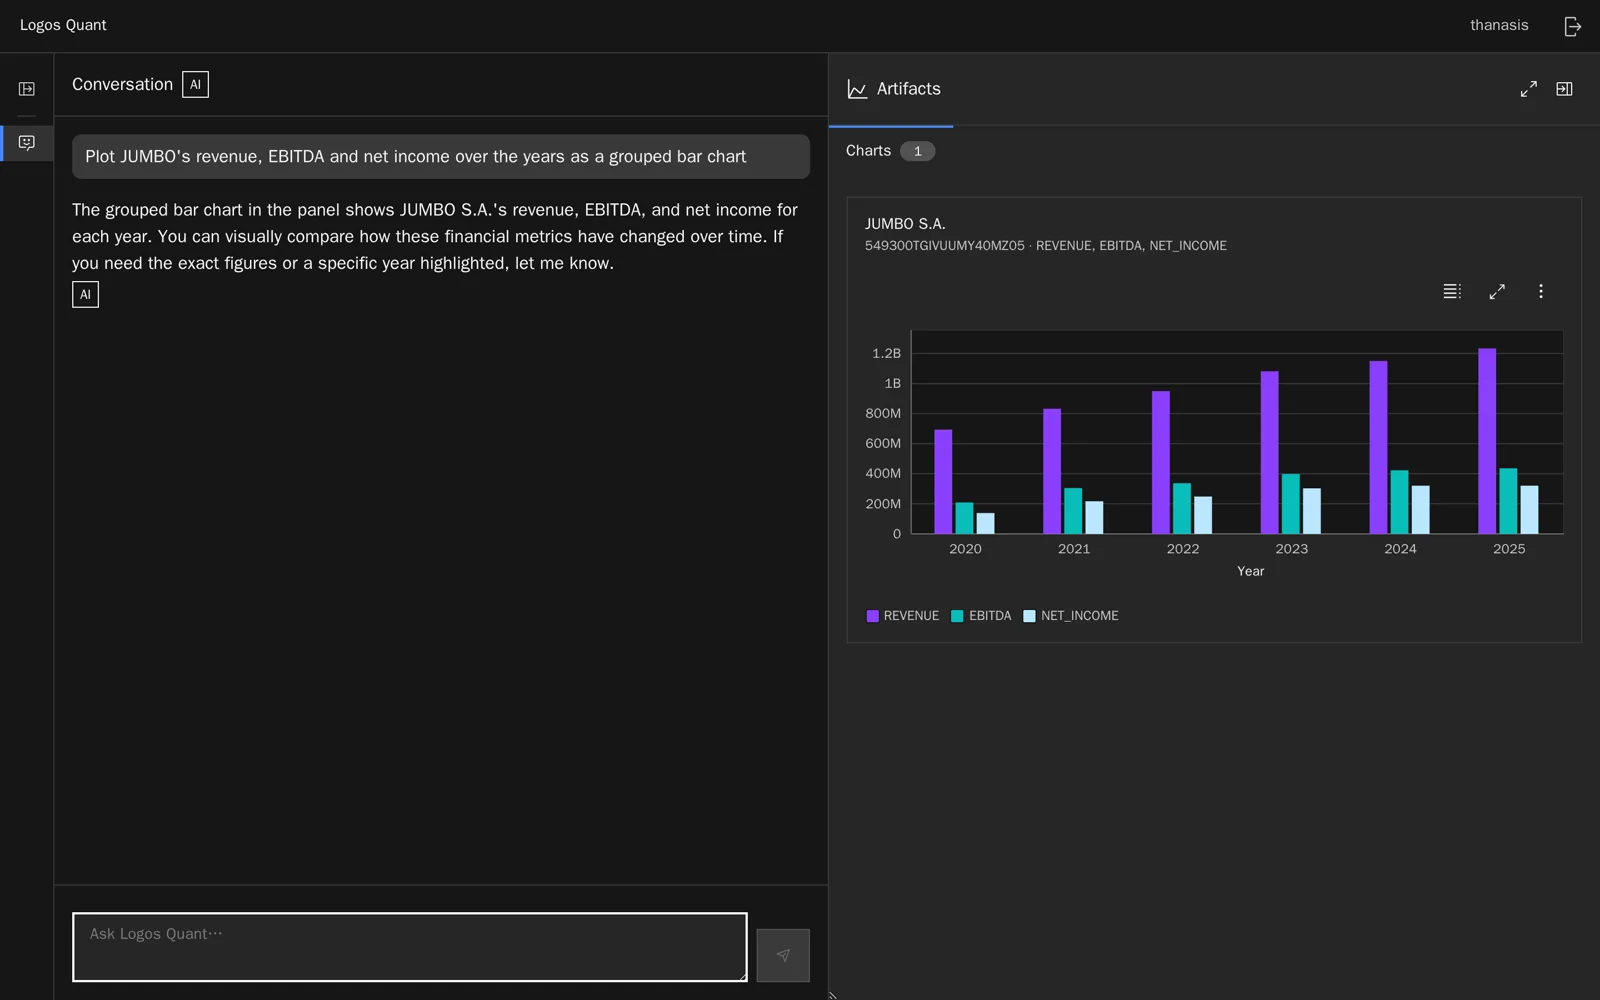
  • Drawn from the data, never generated by the model.
JUMBO’s revenue, EBITDA and net income, 2020 to 2025

When a ratio does not apply, it says why

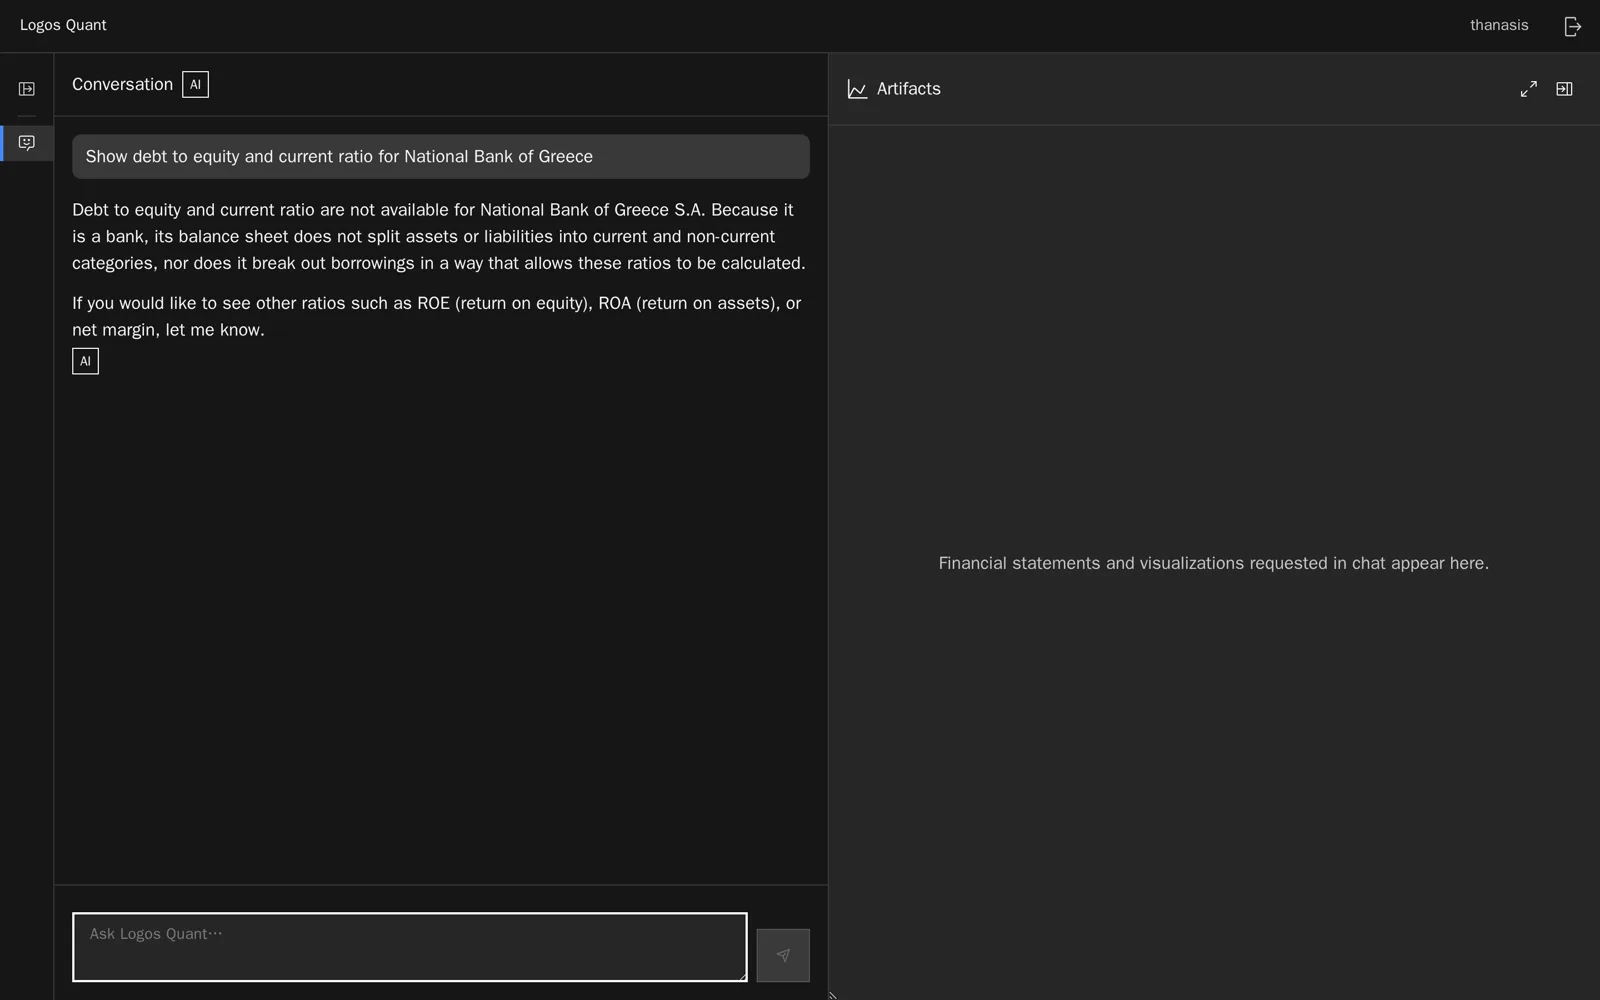
  • A bank orders its balance sheet by liquidity: no current ratio.
  • Expenses by nature: no gross margin. Never a misleading zero.
The assistant explains why National Bank of Greece has no current ratio or debt to equity

Screening the market

  • Rankings, filters and peer comparisons across every company at once.
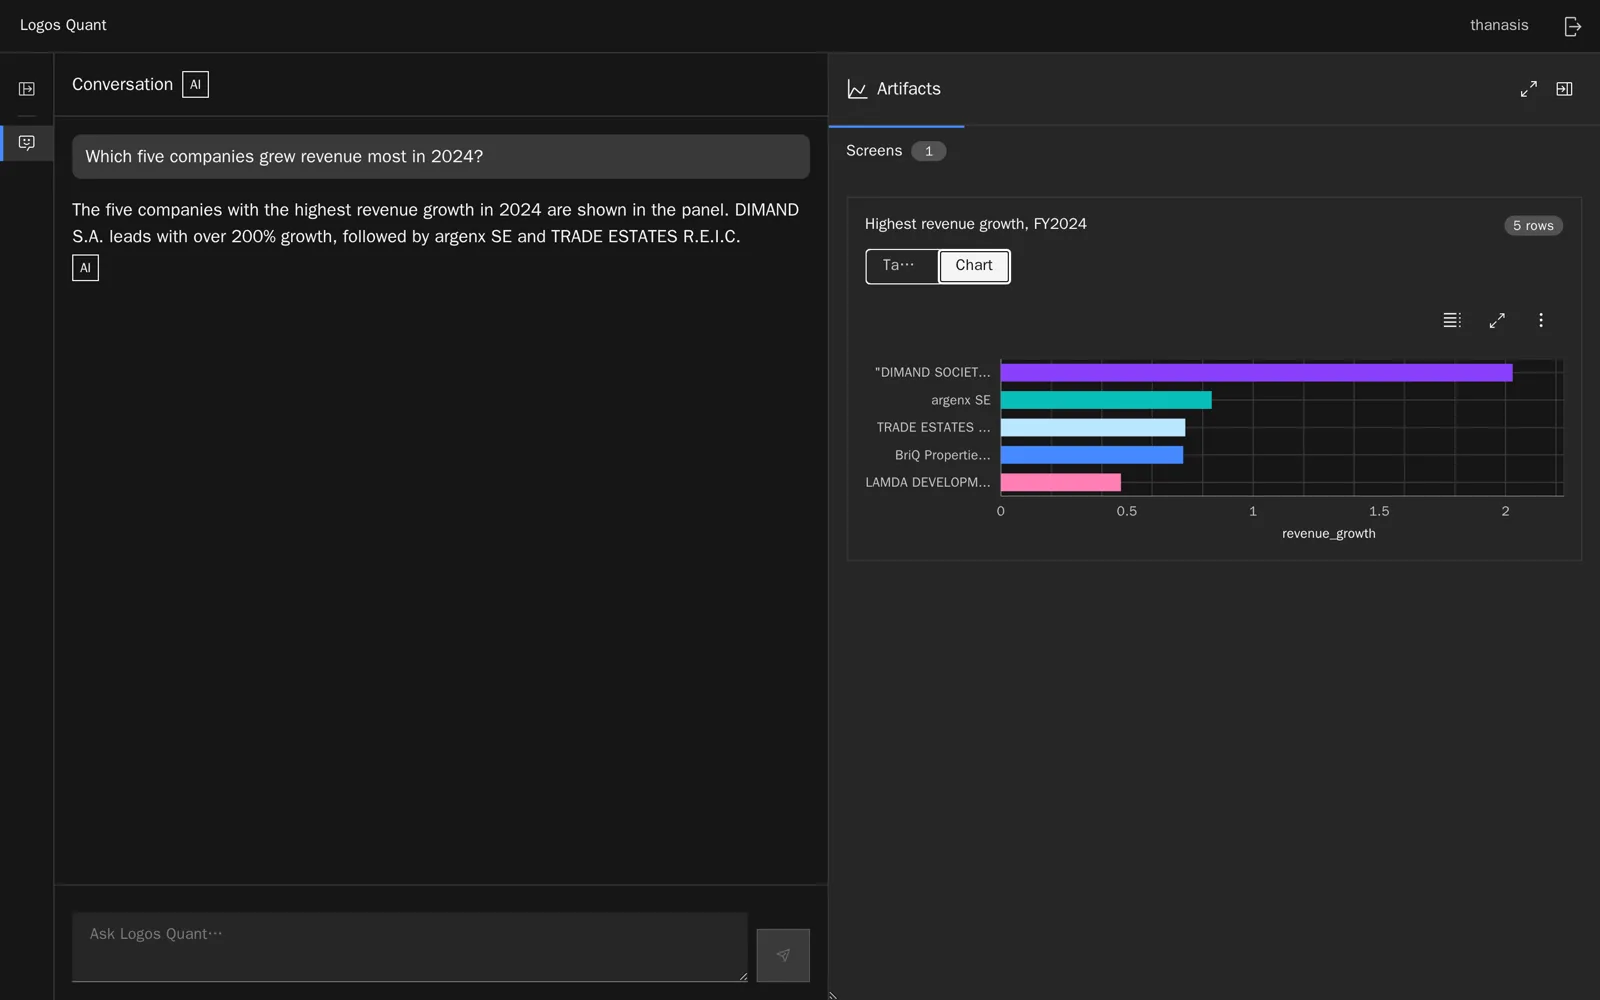
  • Results as a table, with a chart a click away.
The five companies with the highest revenue growth in 2024

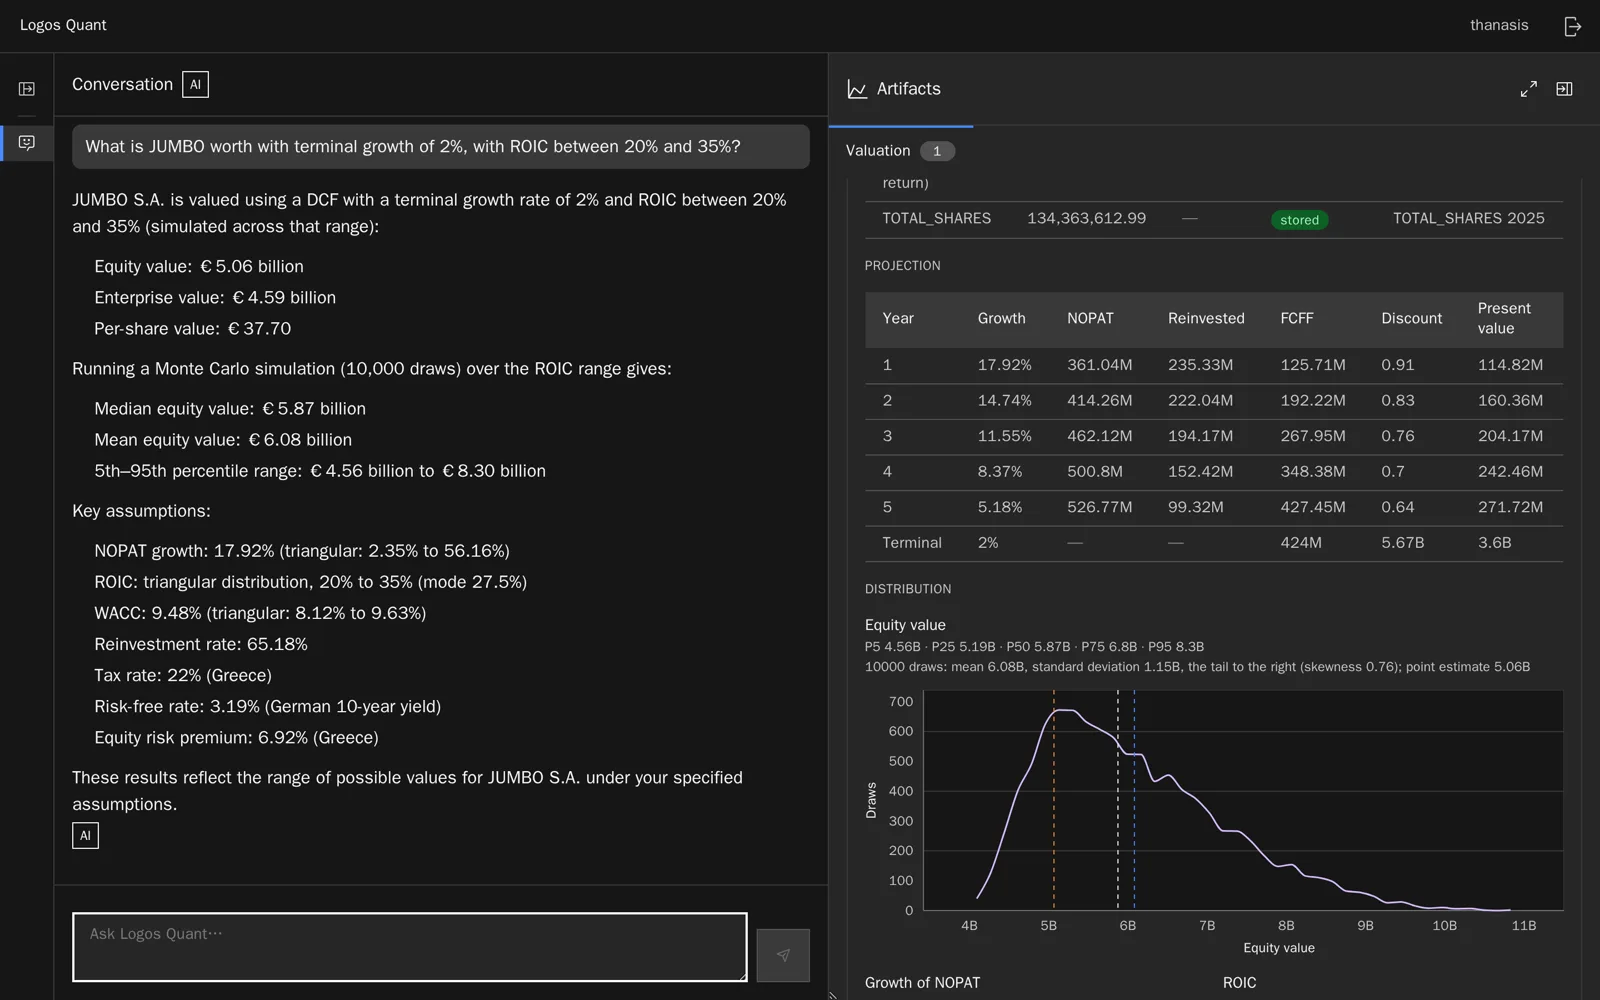
Valuation, with Monte Carlo

  • A DCF on the company’s own years, with every input named and sourced.
  • Give a range and 10,000 draws return a distribution.
JUMBO’s DCF projection and the Monte Carlo distribution of its equity value

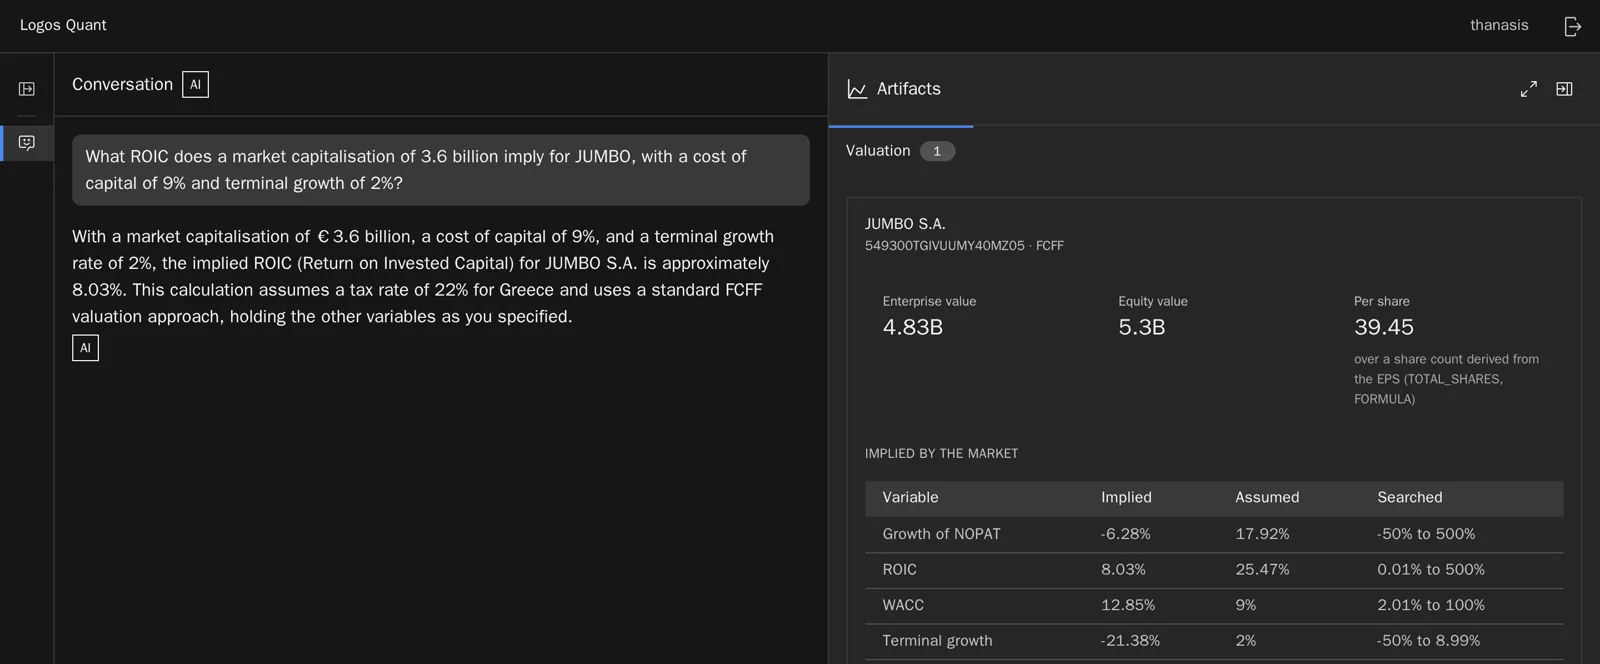
What the market implies

  • A reverse DCF: from the market’s value to the return that justifies it.
  • Shown as what the market assumes, never as a target.
Reverse DCF of JUMBO: at 3.6 billion the market implies an 8% return on capital

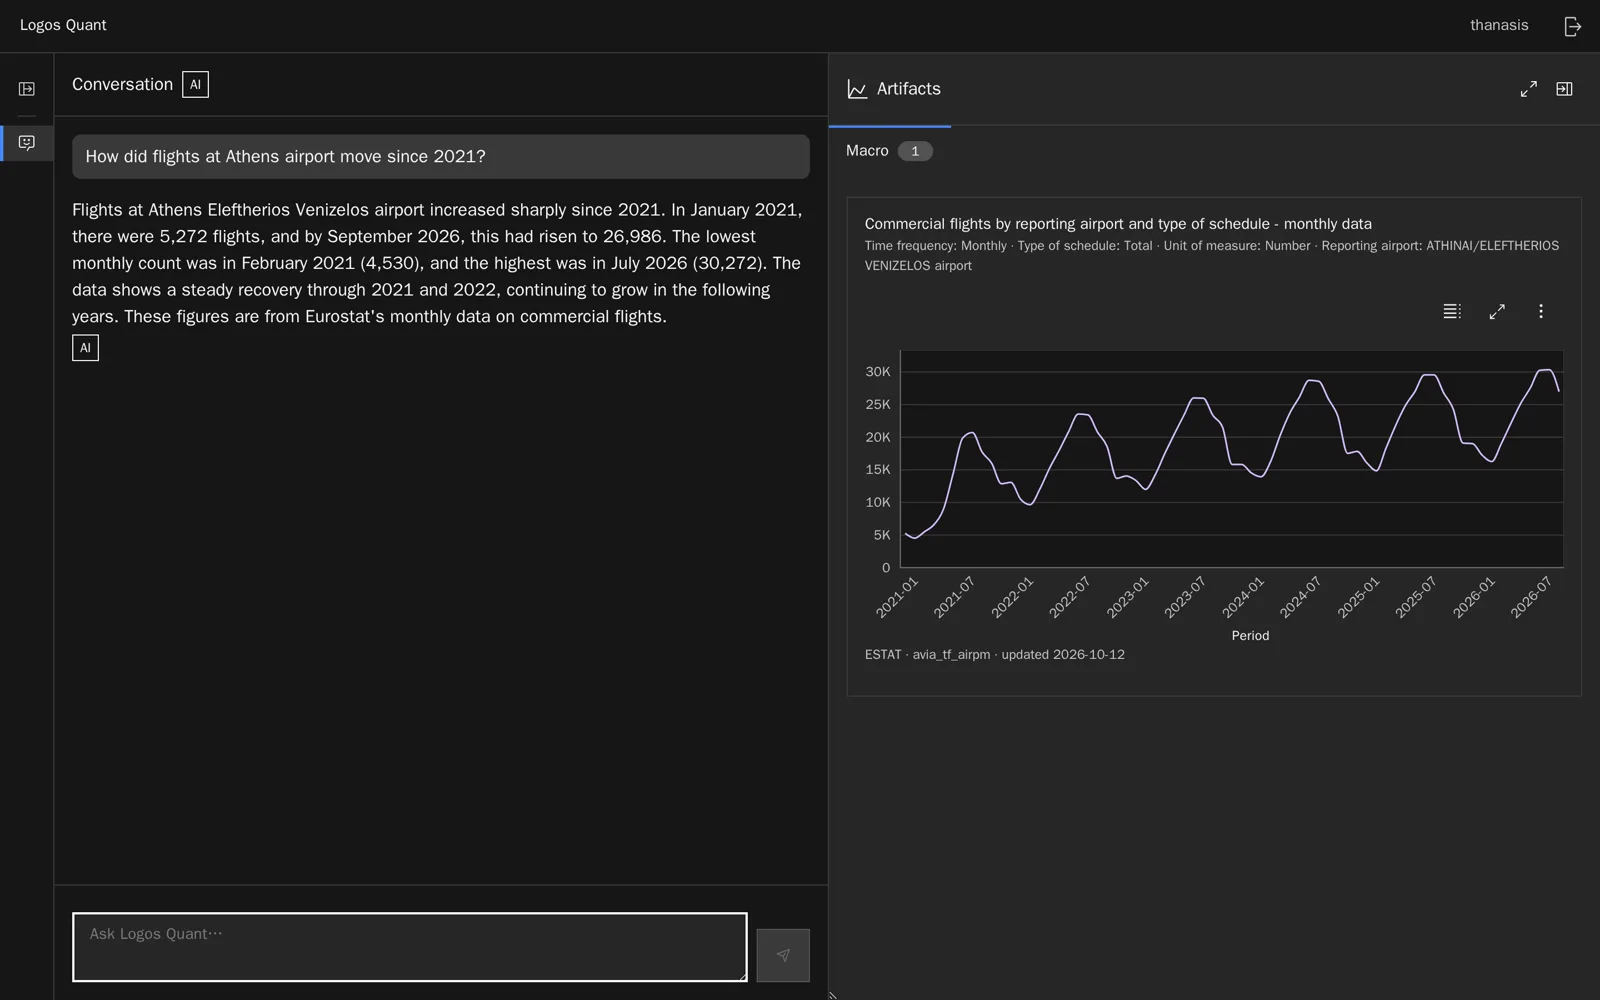
The economy beside the companies

  • Thousands of Eurostat datasets, found by meaning.
  • Read live from the source, in the source’s own words.
Monthly flights at Athens airport since 2021, from Eurostat

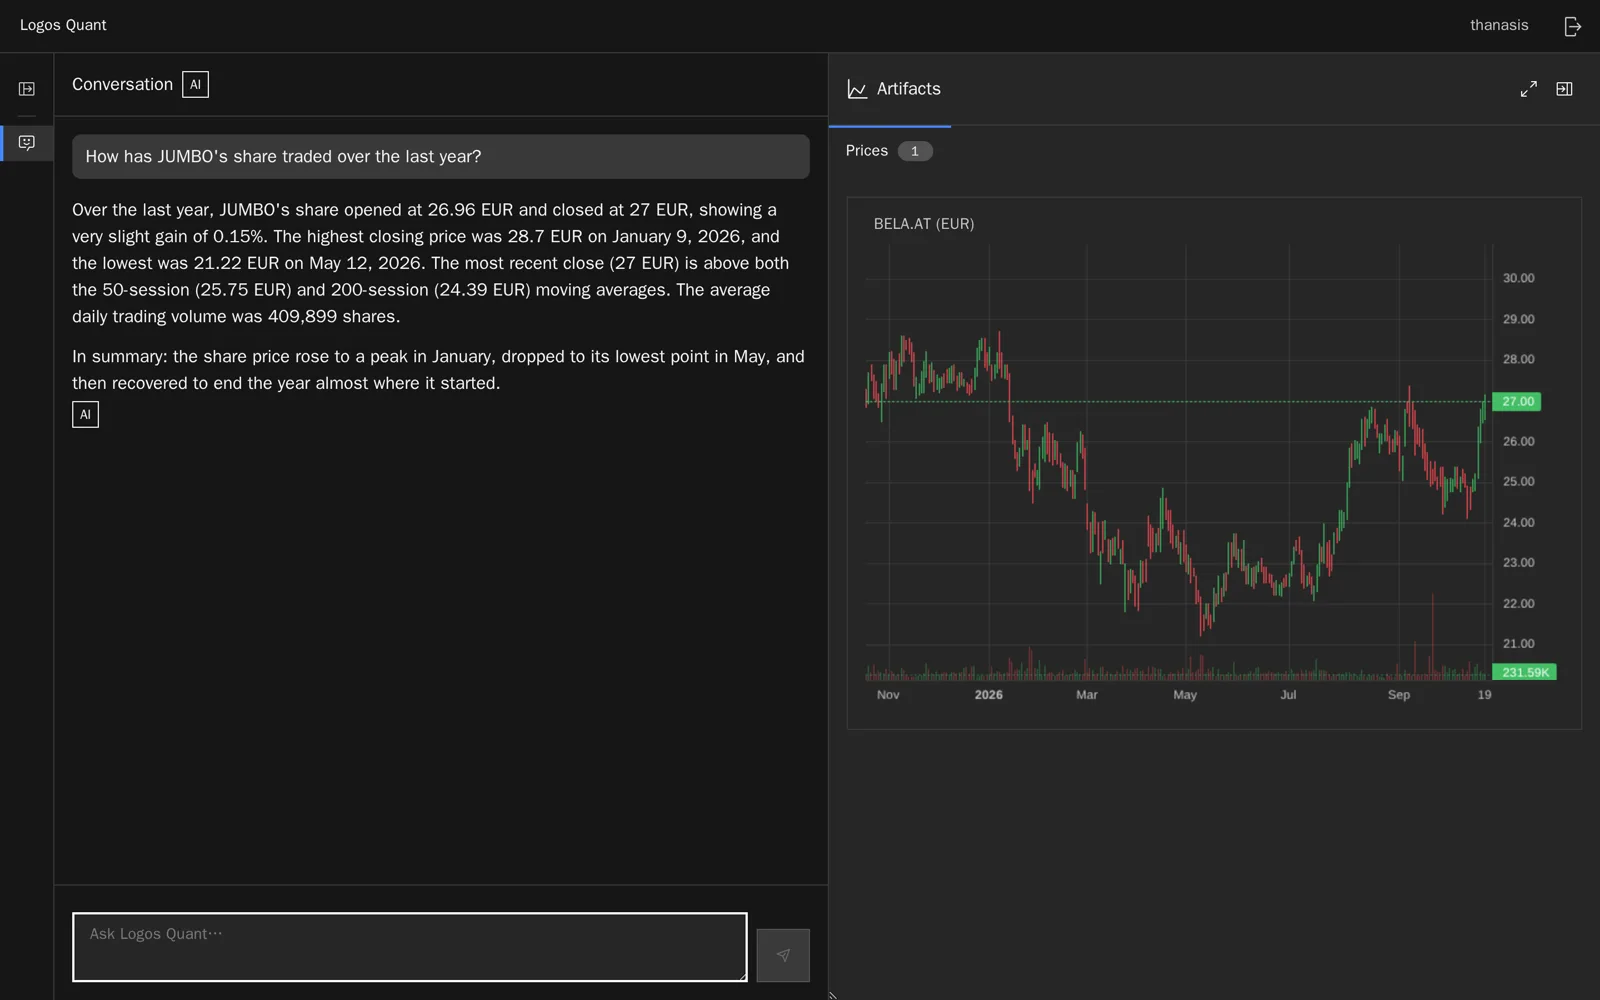
How the share has traded

  • Candlesticks, averages and volume, beside the filings.
  • Described, never forecast. No targets, no buy or sell.
JUMBO’s share over the last year as candlesticks

Why trust it

Built to be checked

Figures come from the filings

The language model explains. It never writes a number.

Every value names its source

The fact it was read from, or the filer’s statement it was summed from.

Corrections by the analyst, audited

A wrong figure is corrected in your name, with your reason. The filing keeps its own.

Official sources only

Filings, company registries and Eurostat. A missing input is named, not estimated.

Try it on a company you know

LogosQuant is onboarding its first pilot users among analysts, family offices and asset managers.